Finding spacecraft earth and moon distances#
As well as spacecraft velocity and position with respect to the solar system barycenter, you can also calculate the position and velocity with respect to the earth and moon.
[43]:
from lkspacecraft import KeplerSpacecraft, TESSSpacecraft
import matplotlib.pyplot as plt
from astropy.time import Time
import numpy as np
First we load the spacecraft object
[44]:
ks = KeplerSpacecraft()
Now we must pick a time that we want to get the position or velocity. I will create a vector which spans the duration of the SPICE kernels
[45]:
start, end = ks.start_time, ks.end_time
[46]:
start, end
[46]:
(<Time object: scale='utc' format='datetime' value=2009-03-07 06:22:56.000025>,
 <Time object: scale='utc' format='datetime' value=2019-12-29 23:58:50.815000>)
[47]:
t = Time(np.linspace(start.jd + 1, end.jd - 1, 5000), format='jd')
t is now an astropy.time.Time object with 5000 points, uniformly spaced from the start of the SPICE kernel time range, to the end. Let’s get the spacecraft position
[48]:
position = ks.get_spacecraft_position(t, "earth")
[49]:
position
[49]:
array([[-2.04469635e+05,  8.53262718e+04,  1.11504844e+05],
       [-3.10023611e+05,  1.08990868e+05,  1.60844558e+05],
       [-4.03007391e+05,  1.29036556e+05,  2.03009433e+05],
       ...,
       [ 1.56225494e+08, -9.43050976e+07, -4.17449450e+07],
       [ 1.57610492e+08, -9.23432888e+07, -4.09067947e+07],
       [ 1.58966185e+08, -9.03630495e+07, -4.00604877e+07]])
This is the position in km, in Cartesian coordinates, with the origin at the earth.
[50]:
fig = plt.figure(figsize=(7, 7))
ax  = fig.add_subplot(111, projection='3d')
im = ax.scatter(*position.T, label='Kepler', c=(t.jd - t.jd[0])/365, s=1)
cbar = plt.colorbar(im, ax=ax, orientation='horizontal')
cbar.set_label("Time since launch [years]")
ax.scatter(0, 0, 0, label='Earth', c='blue', marker='o', s=100)
ax.set(title='Kepler Position w.r.t the earth', xlabel='x [km]', ylabel='y [km]', zlabel='z [km]')
ax.legend();
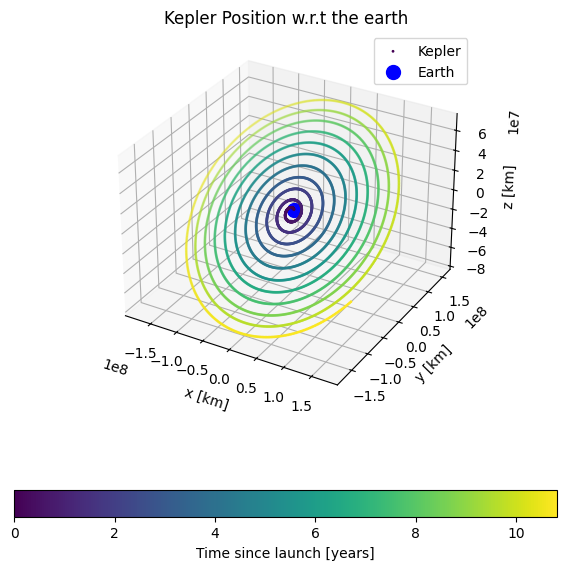
You can see Kepler’s earth trailing orbit slowly getting further and further from earth.
Let’s try the same thing with TESS
[51]:
ts = TESSSpacecraft()
t = Time(np.linspace(ts.start_time.jd + 500, ts.end_time.jd - 1, 15000), format='jd')
[52]:
position = ts.get_spacecraft_position(t, "earth")

fig = plt.figure(figsize=(7, 7))
ax  = fig.add_subplot(111, projection='3d')
im = ax.scatter(*position.T, label='TESS', c=(t.jd - t.jd[0])/365, s=1)
cbar = plt.colorbar(im, ax=ax, orientation='horizontal')
cbar.set_label("Time since launch [years]")
ax.scatter(0, 0, 0, label='Earth', c='blue', marker='o', s=100)
ax.set(title='TESS Position w.r.t the earth', xlabel='x [km]', ylabel='y [km]', zlabel='z [km]')
ax.legend();
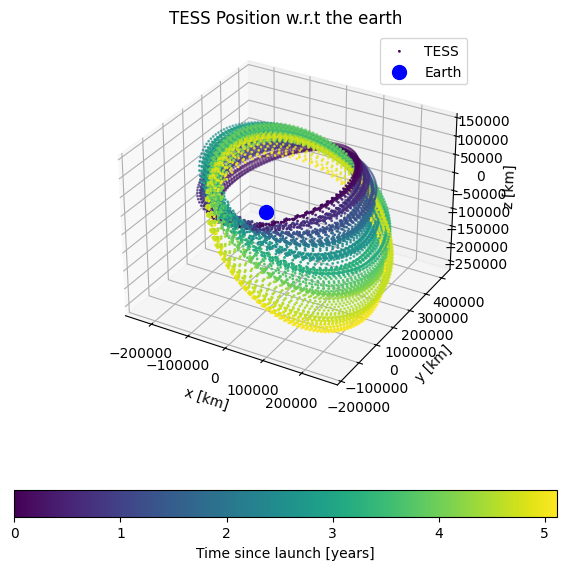
You can see TESS’s orbit around earth slowly precessing. Let’s look at the distance between the moon
[53]:
position = ts.get_spacecraft_position(t, "moon")

fig = plt.figure(figsize=(7, 7))
ax  = fig.add_subplot(111, projection='3d')
im = ax.scatter(*position.T, label='TESS', c=(t.jd - t.jd[0])/365, s=1)
cbar = plt.colorbar(im, ax=ax, orientation='horizontal')
cbar.set_label("Time since launch [years]")
ax.scatter(0, 0, 0, label='Moon', c='grey', marker='o', s=50)
ax.set(title='TESS Position w.r.t the moon', xlabel='x [km]', ylabel='y [km]', zlabel='z [km]')
ax.legend();
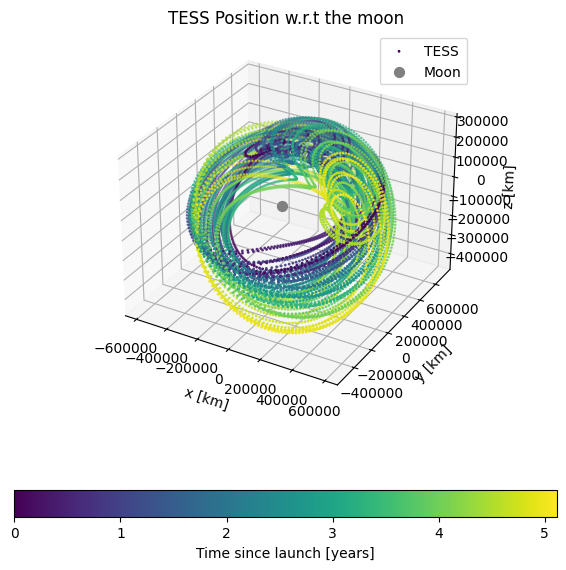
Here we see a much more complicated orbit!
If you want to see the earth and moon positions with respect to the TESS spacecraft, you can do this by simply taking the negative of the positions.
[109]:
position = -ts.get_spacecraft_position(t, "moon")
This is now the position of the moon, with respect to TESS. You can convert this to spherical coordinates to obtain the distance, inclination and azimuthal angle to the moon
[112]:
dist = np.sum(position**2, axis=1)**0.5
inclination = np.rad2deg(np.arcsin(position[:, 2] / dist))
azimuth = np.rad2deg(np.arctan2(position[:, 1], position[:, 0]))
[116]:
fig, ax = plt.subplots()
im = ax.scatter(azimuth, inclination, s=10, c=(t.jd - t.jd[0])/365, label='Moon position from TESS')
cbar = plt.colorbar(im, ax=ax, orientation='horizontal')
cbar.set_label("Time since launch [years]")
ax.set(xlabel='Azimuth [degrees]', ylabel='Inclination [degrees]', title='Moon as view from TESS')
ax.legend()
[116]:
<matplotlib.legend.Legend at 0x126b5ded0>
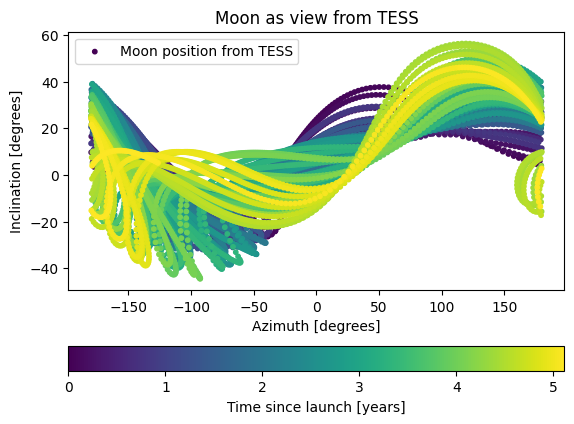
lkspacecraft is only providing the position of the earth and moon with respect to the spacecraft. This doesn’t take into account the orientation of the cameras on the spacecraft, and so as of yet there isn’t a way to directly relate this to a pixel position.